Heat Capacities and Phase Separation Behavior of Amphipathic
Synthetic Polymer Poly(2-(2-ethoxy)ethoxyethyl vinyl ether)
Heat capacities of amphipathic synthetic polymer
poly(2-(2-ethoxy)ethoxyethyl vinyl ether) (PEVE) solutions with 9.4,
15.8, 21.1, and 40.4wt% were measured by adiabatic calorimetry.
All the PEVE solutions exhibited heat capacity steps due to glass
transition around 200 K, large heat capacity peaks due to fusion of
water around 273 K, and heat capacity peaks due to phase separation
around 314 K. From the observed enthalpy of fusion of water, the
amount of unfrozen water was estimated to be 6.2 mol per repeat unit
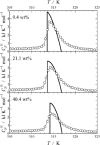
of PEVE. Theoretical excess heat capacity curves calculated in terms
of extended Barker-Henderson theory reproduced experimental excess
heat capacities around the phase separation temperatures roughly.
(by Y. Miyazaki)

|
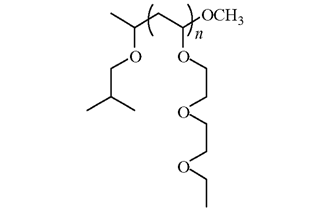
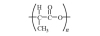
Fig. 1. Repeat unit of PEVE.
|
|
Fig. 2. Heat capacities of PEVE solutions per mole of
repeat unit of PEVE. ○: 9.4wt%, △:
15.8wt%, ☐: 21.1wt%, ▽: 40.4wt%,
●: dried sample. Inset shows heat capacities around phase
separation temperatures.
|
|
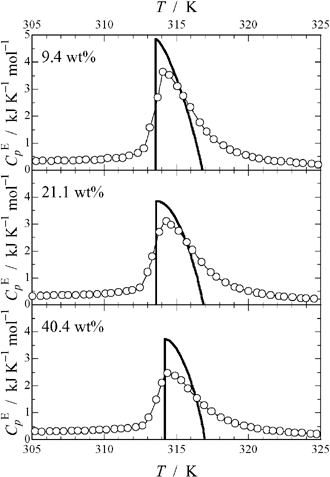
Fig. 3. Excess heat capacities of PEVE solutions with
9.4, 21.1 and 40.4wt%. Thick solid curves are theoretical
excess heat capacities, which reproduce experimental ones
roughly.
|
|
|
Heat Capacities and Glass Transitions of the Biodegradable
Synthetic Polymer Poly(Lactic Acid)
Calorimetry of the biodegradable synthetic polymer poly(lactic acid)
(PLA) were performed by differential scanning and adiabatic
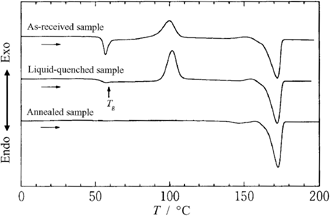
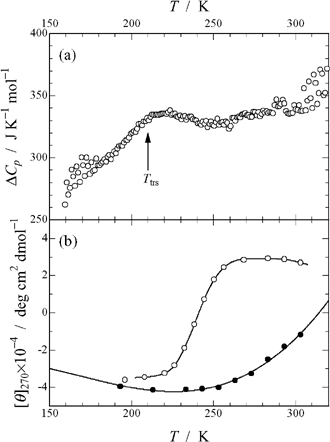
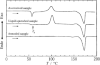
calorimetries. Both DSC signals of as-received and liquid-quenched
samples showed glass transitions around 60 °C, cold
crystallizations around 100 °C, and fusions around
175 °C. On the other hand, DSC
signal of annealed sample around 140 °C exhibited only a
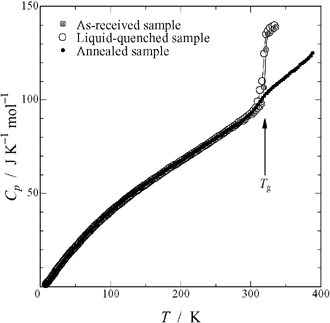
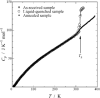
fusion around 175 °C. Heat capacities of both as-received
and liquid-quenched samples indicated large heat capacity jumps around
320 K and
remarkable exothermic effects due to cold crystallizations above
330 K, while heat capacity of annealed sample gave rise to only a
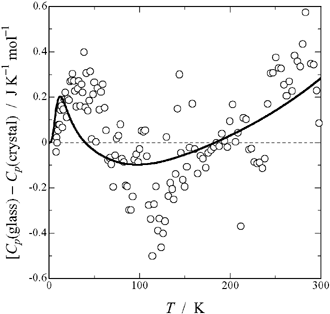
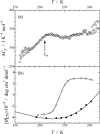
small heat capacity jump due to glass transition. Below 70 K, so-called
low-energy excitation due to glass was observed, in which the heat
capacity of the glassy state became larger than that of the
crystalline state. However, the heat capacity of the crystalline state
became larger than that of the glassy state between 70 and 200 K
against the usual phenomenon.
(by Y. Miyazaki)
|
Fig. 1. Repeat unit of PLA.
|
|
Fig. 2. DSC thermogram for PLA.
|
|
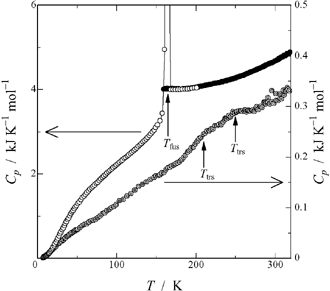
Fig. 3. Heat capacities of PLA per mole of repeat unit
of PLA. ◎: As-received sample, ○: liquid-quenched
sample, ●: annealed sample. All the samples exhibited
glass transitions around 320 K.
|

|
Fig. 4. Heat capacity differences between glassy and
crystalline states of PLA. Solid curve represents heat capacity
difference between the contributions of the skeletal vibrations
for glassy and crystalline states of PLA.
|
Heat Capacity and Helix Reversal of the Synthetic Polymer
Poly{3-[(S)-2-methylbutoxy]phenyl isocyanate} in
Tetrahydrofuran
Heat capacities of the synthetic polymer
poly{3-[(S)-2-methylbutoxy]phenyl isocyanate} (PPIC) and its
tetrahydrofuran (THF) solution with 7.560wt% of concentration were
measured by adiabatic calorimetry. Bulk sample exhibited two broad
heat capacity peaks due to transitions around 210 and 250 K,
while THF solution sample showed a broad heat capacity peak due to
transition around 210 K together with a sharp heat capacity peak
due to fusion of THF at 164.5 K. From the observed enthalpy of
fusion of THF, the amount of unfrozen THF was estimated to be
1.3 mol per repeat unit of PPIC. The change of sign of CD signal
in the THF solution sample seems to correspond not to the heat
capacity peak temperature of the THF solution sample but to the higher
heat capacity peak temperature of the bulk sample.
(by Y. Miyazaki)

|
Fig. 1. Repeat unit of PPIC.
|

|
Fig. 2. Heat capacities of THF solution of PPIC with
7.560wt% of concentration and bulk PPIC per mole of repeat
unit of PPIC. ○, ●:
THF solution sample, ◎: bulk sample. Two broad peaks due to
transitions were observed around 210 and 250 K for the bulk
sample. The THF solution sample exhibited only a sharp peak due
to fusion of THF at 164.5 K.
|
|
Fig. 3. (a) Apparent heat capacities of PPIC in THF
solution. A broad peak due to transition were found around
210 K. (b) CD signals of THF and dichloromethane solution
samples. ○: THF solution sample, ●: dichloromethane
solution sample.
|
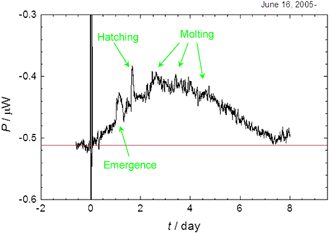
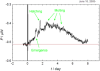
Calorimetry of a Single Larva
of Artemia
Isothermal miocrocalorimeter was modified to measure slow and weak
thermal dissipation for developmental biology. Post-dormant
development of a single larva of Artemia
franciscana (Great Salt Lake) was measured as a function of
incubation time
at T=293.17 K. Characteristic thermal
dissipations were observed at emergence, hatching and every molting.
(by Y. Nagnano)
|
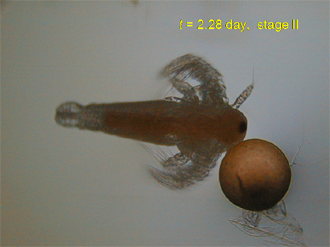
Photo 1. Prenauplius larva
of Artemia in umbrella state.
|

|
Photo 2. Nauplius larva
of Artemia at the second stage.
|
|
Fig. 1. Thermal dissipation of a nauplius larva
of Artemia.
|
|
|
Copyright © Research Center for Structural Thermodynamics,
Graduate School of Science, Osaka University. All rights reserved.