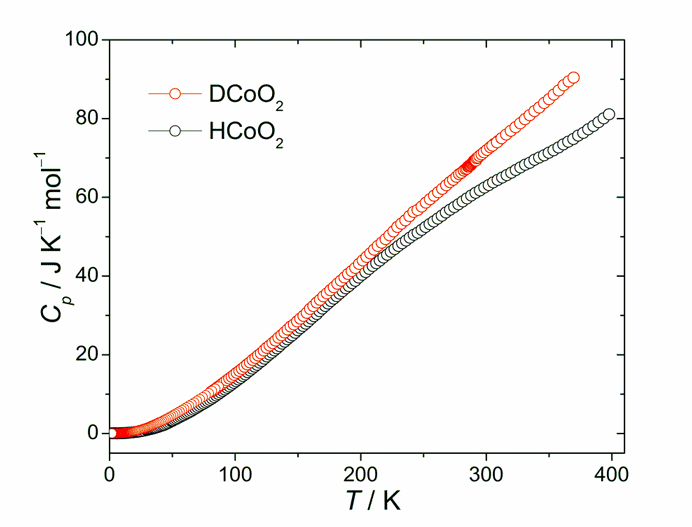
 Fig. 1. Molar heat capacity obtained for DCoO2 and HCoO2 with adiabatic calorimetry in temperatures between 2 and 400 K.
In the system with short hydrogen bonds, the phase transition can be induced by deuterium effect. The example is α-HCrO2 and its deuterated analog which have been investigated by several methods such as adiabatic calorimetry, X-ray and neutron powder diffraction and IR spectroscopy. A lambda-type anomaly in heat capacity occurred at T1 = 320 K for DCrO2 but not for HCrO2. The phase transition temperature is exceptionally high among the deuteration-induced phase transitions (T. Matsuo et al., J. Mol. Struct. 790, 129 (2006)). The differences in behavior of IR spectra versus temperature observed for those two compounds are explained by different potential barriers for the O–H–O and O–D–O bonds. The former is considered symmetric and the latter is asymmetric.
In this study the thermal behavior of isostructural compound HCoO2 and its deuterated analog have been investigated using relaxation calorimetry (PPMS) (1.8 – 20 K), adiabatic calorimetry (5 – 400 K), thermal analysis (TGA-DTA) (300 – 1250 K) and Fourier transform middle infrared absorption spectroscopy (FT-MIR) (9 – 300 K). The synthesis of the compounds studied is highly sensitive to experimental conditions such as temperature, pressure, oxidizing process, aging time and pH value. Although elemental analysis of cobalt content was found to be equal to theoretical value within the error limit of 2.3 % for both compounds, the X-ray powder diffraction studies showed some Co3O4 impurity existing in deuterated sample whereas the protonated sample was pure.
Fig. 1. Molar heat capacity obtained for DCoO2 and HCoO2 with adiabatic calorimetry in temperatures between 2 and 400 K.
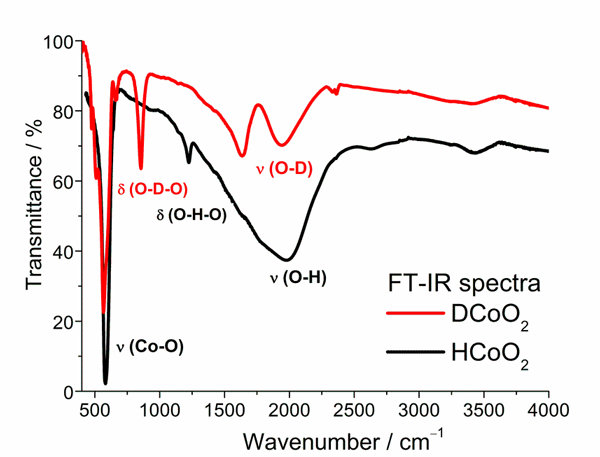 Fig. 2. FT-IR spectra of DCoO2 and HCoO2 registered at room temperature.
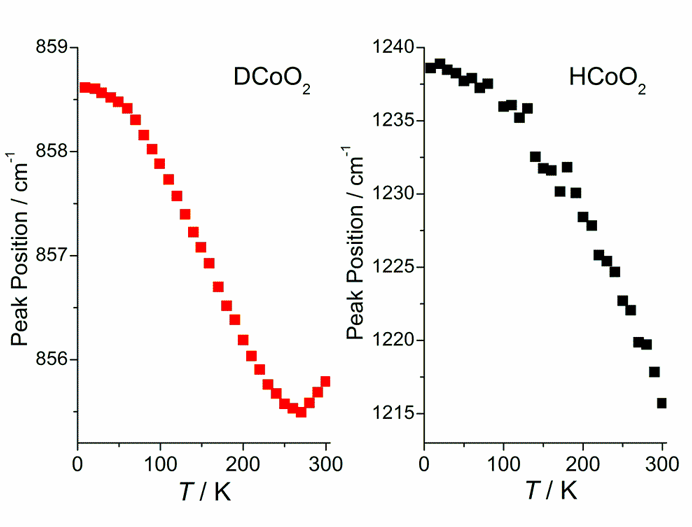 Fig. 3. Temperature dependences of the peak position of the bands connected with O–D–O and O–H–O bending vibrations observed in DCoO2 and HCoO2, respectively.
Fig. 1 presents heat capacity curves obtained for polycrystalline DCoO2 and HCoO2. Interestingly, both compounds exhibit no phase transition, unlike α-HCrO2, where the deuteration induced phase transition was observed. Additionally, from thermal analysis, there is no anomalous behavior observed in TG-DTA curves for these compounds in temperatures above 300 K except for their conversion into Co3O4 (at 570 K for DCoO2 and at 595 K for HCoO2) and subsequently into CoO at 1160 K.
The FT-IR spectra obtained at room temperature for both samples pressed in KBr disks are presented in Fig. 2. Band assigned to deuterium bending vibration in DCoO2 is located at 856 cm-1 whereas the one assigned to hydrogen bending vibration in HCoO2 can be observed at 1215 cm-1. Additionally, the spectrum of HCoO2 exhibits very broad peak with a maximum at about 1970 cm-1, which is connected with hydrogen stretching vibration. In turn, the spectrum of DCoO2 shows two apparent bands at 1630 and 1950 cm-1, which are connected with deuterium stretching vibrations. The obtained spectra are very analogical to the ones for corresponding chromium compounds what suggests very similar molecular structure of these materials.
Fig. 3 presents temperature dependences of the peak position of the bands connected with deuterium (hydrogen) bending vibrations observed in DCoO2 and HCoO2, respectively. In both compounds, the peak position value increases gradually with decreasing temperature except for the high temperature region (above 270 K) for deuterated sample, where the value initially decreases with decreasing temperature. At temperatures close to
0 K the peak position values for both compounds become constant.
More studies need to be done in order to understand a significant difference in the thermal behavior of HCoO2–DCoO2 and HCrO2–DCrO2 systems.
A. Inaba and N. Górska, the 47th Japanese Conference on Calorimetry and Thermal Analysis (Kiryu), 1B1440 (2011).
Copyright © Research Center for Structural Thermodynamics, Graduate School of Science, Osaka University. All rights reserved.